Page 12 - Moreno Valley City Manager's Report for 2024
P. 12

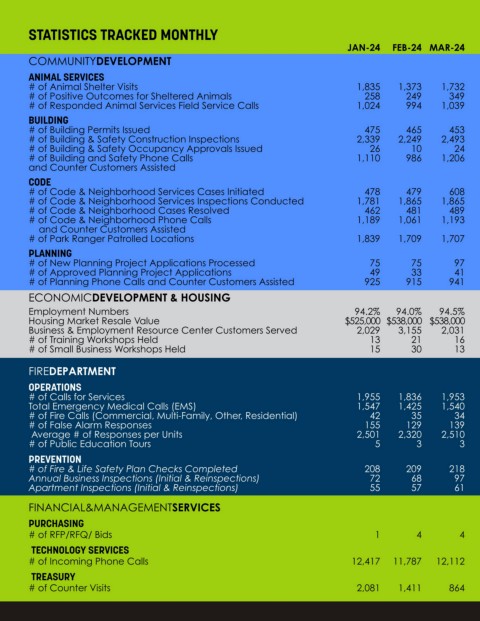
STATISTICS TRACKED MONTHLY

                                                                                          JAN-24     FEB-24 MAR-24            APR-24 MAY-24         JUN-24     JUL-24 AUG-24         SEP-24 OCT-24 NOV-24 DEC-24                 TOTAL
        COMMUNITYDEVELOPMENT
        ANIMAL SERVICES
        # of Animal Shelter Visits                                                           1,835     1,373      1,732         1,334       1,694     1,704      1,583      1,523      1,249     1,212      1,298      1,215   17,752
        # of Positive Outcomes for Sheltered Animals                                            258      249        349           230         234       297        338        310        208       289        198        176      3,136
        # of Responded Animal Services Field Service Calls                                    1,024      994      1,039         1,084       1,077     1,074        983      1,082        820     1,091        911        899   12,078
        BUILDING
        # of Building Permits Issued                                                            475      465        453           547         574       512        606        470      2,507       514        425        346      7,894
        # of Building & Safety Construction Inspections                                       2,339    2,249      2,493         2,433       2,977     2,572      3,385      2,945      2,507     2,897      2,573      2,680   32,050
        # of Building & Safety Occupancy Approvals Issued                                        26       10         24             30         24         12        21         34         40         15         50        22        308
        # of Building and Safety Phone Calls                                                  1,110      986      1,206         1,201       1,711     1,376      1,451      1,678      1,485     1,578      1,541      1,354   16,677
        and Counter Customers Assisted
        CODE
        # of Code & Neighborhood Services Cases Initiated                                       478      479        608           680         655       492        618        606        676       761        525        487      7,065
        # of Code & Neighborhood Services Inspections Conducted                              1,781     1,865      1,865         2,118       2,105     1,719      2,001      2,119      2,191     2,567      1,942      1,982   24,255
        # of Code & Neighborhood Cases Resolved                                                462       481        489           575         545       463        509        507        486       603        537        474      6,131
        # of Code & Neighborhood Phone Calls                                                  1,189    1,061      1,193         1,318       1,270     1,132      1,402      1,316      1,176     1,320      1,288        791   14,456
           and Counter Customers Assisted
        # of Park Ranger Patrolled Locations                                                1,839      1,709      1,707         1,970       2,176     1,906      2,411      2,411      2,192     2,294      2,196      2,061   24,872
        PLANNING
        # of New Planning Project Applications Processed                                         75       75         97           106         106         99       104        101         93       114          85        52      1,107
        # of Approved Planning Project Applications                                              49       33         41             38         36         34        36         32         33         39         23        41        435
        # of Planning Phone Calls and Counter Customers Assisted                               925       915        941           791         987       804        848        987      1,014     1,094      1,020        844   11,170
        ECONOMICDEVELOPMENT & HOUSING

        Employment Numbers                                                                  94.2%     94.0%      94.5%         94.9%       95.4%     94.4%      94.0%      94.1%      94.5%     94.4%      94.5%      94.5%     94.5%*
        Housing Market Resale Value                                                        $525,000   $538,000   $538,000    $575,000   $550,000   $570,000   $578,000   $560,000   $555,000   $555,000   $565,000   $565,000  $556,166*
        Business & Employment Resource Center Customers Served                                2,029    3,155      2,031         1,875       2,027     1,886      2,167      1,410      2,107     2,181      2,791      1,910   25,569
        # of Training Workshops Held                                                             13       21         16             18         19         12        17         12         18         16         21        19        202
        # of Small Business Workshops Held                                                       15       30         13             24         14         24          9         6         30         35         22        15        237

        FIREDEPARTMENT

        OPERATIONS
        # of Calls for Services                                                              1,955     1,836      1,953         1,928       1,982     2,096      2,042      2,206      2,003     2,083      1,915      2,245   24,244
        Total Emergency Medical Calls (EMS)                                                   1,547    1,425      1,540         1,523       1,556     1,588      1,560      1,691      1,502     1,577      1,463      1,748   18,720
        # of Fire Calls (Commercial, Multi-Family, Other, Residential)                           42       35         34             31         35         66        63         40         59         64         59        53        581
        # of False Alarm Responses                                                             155       129        139           137         145       170        168        175        151       172        150        168      1,859
         Average # of Responses per Units                                                     2,501    2,320      2,510         2,456       2,420     2,903      2,611      2,962      2,783     2,846      2,662      3,030   32,004
        # of Public Education Tours                                                               5         3          3            15         22          9        11           -         6         18          9        13        114
        PREVENTION
        # of Fire & Life Safety Plan Checks Completed                                          208       209        218           158         218       246        266        228        218       298        223        239      2,729
        Annual Business Inspections (Initial & Reinspections)                                    72       68         97             73        111       134        336        267        175       150        111        169      1,763
        Apartment Inspections (Initial & Reinspections)                                          55       57         61             74        185         97        96         60         88         99         99        78      1,049

        FINANCIAL&MANAGEMENTSERVICES
        PURCHASING
        # of RFP/RFQ/ Bids                                                                        1         4          4             5          6          6          6         4         10          6          4          8        64

         TECHNOLOGY SERVICES
        # of Incoming Phone Calls                                                           12,417   11,787   12,112           12,563     12,004   11,498   12,693   11,736   10,292   13,073               9,197      8,644   138,016
         TREASURY
        # of Counter Visits                                                                   2,081    1,411        864           843         838       769        817        865        743       841        747      1,355   12,174
   7   8   9   10   11   12   13   14   15   16