Page 14 - Moreno Valley City Manager's Report for 2024
P. 14

JAN-23     FEB-23 MAR-23            APR-23 MAY-23         JUN-23     JUL-23 AUG-23         SEP-23 OCT-23 NOV-23           DEC-23       TOTAL
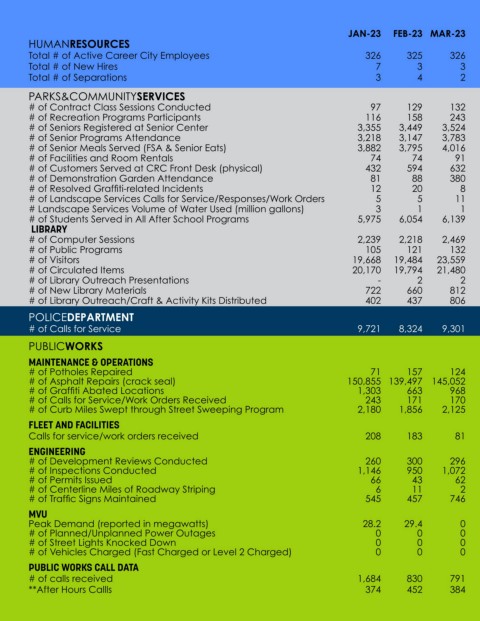
        HUMANRESOURCES
        Total # of Active Career City Employees                                                326       325        326            378        375       374        374        373        376       379        376        367       362*
        Total # of New Hires                                                                      7         3          3             2          4          3          5         6          3          6          1          1        44
        Total # of Separations                                                                    3         4          2              -         7          4          5         7           -         3          4        10         49

        PARKS&COMMUNITYSERVICES
        # of Contract Class Sessions Conducted                                                  97       129        132            121        120       152        126        116        120       148        116        124      1,501
        # of Recreation Programs Participants                                                  116       158        243            233        212       345        447        221        251       282        828        746      4,082
        # of Seniors Registered at Senior Center                                             3,355     3,449      3,524          3,637      3,718     3,835      3,915      4,024      4,129     4,209      4,320      4,342   46,457
        # of Senior Programs Attendance                                                      3,218     3,147      3,783          3,884      4,103     3,457      4,198      4,365      4,079     4,535      3,458      3,633   45,860
        # of Senior Meals Served (FSA & Senior Eats)                                         3,882     3,795      4,016          4,869      5,022     4,657      5,095      5,670      4,836     5,265      4,687      4,732   56,526
        # of Facilities and Room Rentals                                                        74        74         91            114        138       150        121        117        127       118         98         87      1,309
        # of Customers Served at CRC Front Desk (physical)                                     432       594        632            349        338       479        342        346        272       190        203        153      4,330
        # of Demonstration Garden Attendance                                                    81        88        380            355         94         61        50         31        123         63       720        339      2,385
        # of Resolved Graffiti-related Incidents                                                12        20           8            18         35         20        17         30         16         11        11         15        213
        # of Landscape Services Calls for Service/Responses/Work Orders                           5         5        11             19         18         24        24         31         26         14        19         19        215
        # Landscape Services Volume of Water Used (million gallons)                               3         1          1             2          7         10        12         16         18         14        13           9       107
        # of Students Served in All After School Programs                                    5,975     6,054      6,139          6,114      6,006     3,418        219      6,341      6,750     6,825      6,777      6,642   67,260
         LIBRARY
        # of Computer Sessions                                                                2,239    2,218      2,469          2,576      2,575     2,563      4,389      3,224      3,081     3,170      2,253      2,070   32,827
        # of Public Programs                                                                    105      121        132            121        115       111        119        113        103       116         92         71      1,319
        # of Visitors                                                                        19,668   19,484   23,559          23,470   21,019   22,645   26,720   24,010   23,231   23,661   18,947   17,737   264,151
        # of Circulated Items                                                                20,170   19,794   21,480          20,696   20,787   22,297   23,802   21,750   22,599   23,086   21,525   20,329   258,315
        # of Library Outreach Presentations                                                         -       2          2             2          6          7        10          1          3           -         2          1        36
        # of New Library Materials                                                             722       660        812            222        809       916        384        505        475       418        292        702      6,917
        # of Library Outreach/Craft & Activity Kits Distributed                                402       437        806          1,467        439       817        551        531        320       378        592        199      6,939

        POLICEDEPARTMENT
        # of Calls for Service                                                                9,721    8,324      9,301          8,926      9,777     9,339      9,345   10,306        9,564   10,301       9,434      8,434   104,338
        PUBLICWORKS

        MAINTENANCE & OPERATIONS
        # of Potholes Repaired                                                                   71      157        124             73         45       148        119        145        120       125        115        165      1,407
        # of Asphalt Repairs (crack seal)                                                  150,855   139,497   145,052         51,224            -          -     45,659   123,521   222,800   261,554   134,374   54,867  1,329,403
        # of Graffiti Abated Locations                                                        1,303      663        968          1,030        944     1,054      1,238        797      1,055     1,109        900        811   11,872
        # of Calls for Service/Work Orders Received                                             243      171        170            141        144       115        165        155        221       159        112        130      1,926
        # of Curb Miles Swept through Street Sweeping Program                                2,180     1,856      2,125          1,958      2,336     1,532      2,341      2,653      2,225     3,093      2,384      2,233   26,916

        FLEET AND FACILITIES
        Calls for service/work orders received                                                  208      183         81            166        272       350        350        121        138       211        113        110      2,303
        ENGINEERING
        # of Development Reviews Conducted                                                      260      300        296            310        291       204        301        305        290       288        289        252      3,386
        # of Inspections Conducted                                                            1,146      950      1,072          1,008      1,053       914      1,052        958        951     1,088        883        911   11,986
        # of Permits Issued                                                                      66       43         62             64         71         67        57         50         94         80        39         38        731
        # of Centerline Miles of Roadway Striping                                                 6       11           2             2         28         84        67         13          9         10        35           8       275
        # of Traffic Signs Maintained                                                           545      457        746            751        830       941        735        472        465       759        611        411      7,723
        MVU
        Peak Demand (reported in megawatts)                                                    28.2     29.4          0             28         30        30         45         57       58.8        63       52.8       29.6    451.80
        # of Planned/Unplanned Power Outages                                                      0        0          0              0          7        12         32         33         34        30         33         14       195
        # of Street Lights Knocked Down                                                           0        0          0              0       630           0     1292           0         56       307          0          0      2285
        # of Vehicles Charged (Fast Charged or Level 2 Charged)                                   0        0          0              0          1          0         2          0          2          1         0          0          6

        PUBLIC WORKS CALL DATA
        # of calls received                                                                  1,684       830        791          3,722      4,411     3,519      4,929      7,004      6,930     7,102      5,621      3,140   49,683
        **After Hours Callls                                                                   374       452        384            663      1,689       933      1,287      2,213      2,186     2,269      1,635        771   14,856
   9   10   11   12   13   14   15   16